PDF Table Extraction: Why Structure Recognition Breaks
By Zakaria El Houda
A PDF does not contain tables. This is the fact that breaks most people's mental model of PDF table extraction. A PDF contains positioned text fragments, individual characters placed at specific (x, y) coordinates on a page. When you open a fund's Statement of Operations in pdfplumber, here is what the file actually contains:
import pdfplumber

pdf = pdfplumber.open("fund-annual-report.pdf")
page = pdf.pages[13]

for word in page.extract_words()[:8]:
    print(f"  ({word['x0']:6.1f}, {word['top']:6.1f})  {word['text']}")
  ( 72.0, 500.2)  Revenue
  (300.4, 500.1)  $1,234
  (450.1, 500.3)  $1,456
  ( 90.0, 485.0)  Cost
  (115.3, 485.0)  of
  (128.7, 485.0)  Goods
  (156.2, 485.0)  Sold
  (300.4, 485.1)  $789
No rows, no columns, no cells. "Cost of Goods Sold" is four separate text fragments that happen to sit near the same y-coordinate. The grid you see when you look at a financial statement is an emergent property of spatial positioning. Nothing in the file says "these five numbers belong to the same row."
That gap between what exists in the file and what a human sees on screen is where every extraction pipeline breaks.
In the first post in this series, we covered the demo-to-production gap in document processing. This post goes deep on the hardest subproblem: getting structured data out of tables.
Why Tables Break Every Extraction System
Table detection on clean, born-digital documents is solved. Microsoft's Table Transformer (TATR) hits 0.995 AP50 on the PubTables-1M benchmark1. Finding the table on the page is not the problem.
Structure recognition is the problem. Determining which cells share a row, which share a column, which headers govern which data cells, and where spanning cells break the grid. On simple tables with no merged cells, current models achieve 98-99% TEDS2. On complex financial tables with hierarchical headers and spanning cells, that number drops to 78-82% depending on the model and the document type.
Five specific failure modes account for most production errors.
Borderless Tables
The majority of real-world tables have no gridlines. Financial statements use horizontal rules under headers and above totals but no vertical rules. Scientific papers use the three-line convention (top, header separator, bottom). Government forms mix bordered and borderless regions.
For borderless tables, the extraction system must infer column boundaries from whitespace alignment and row boundaries from vertical proximity. These heuristics break with inconsistent spacing, multi-line cell content, or variable font sizes. A single cell with two lines of wrapped text gets split into two rows, corrupting every row below it.
Merged Cells and Spanning Headers
Consider a fund's Statement of Operations with headers like:
                    Year Ended December 31,
                   2024            2023
               Q3      Q4      Q3      Q4
Revenue      1,234   1,456   1,100   1,200
Three levels of hierarchy. "Year Ended December 31," spans all four data columns. "2024" and "2023" each span two. The value 1,234 means "Revenue, Q3 2024," but only if the extraction system correctly resolves the spanning relationships.
Here is what most extraction tools produce from this table. Textract, Document AI, and similar services return a flat structure:
{"headers": ["Year Ended December 31,", "2024", "2023", "Q3", "Q4", "Q3", "Q4"],
 "rows": [["Revenue", "1,234", "1,456", "1,100", "1,200"]]}
The hierarchy is flattened. Which Q3 is which? Is 1,234 from Q3 2024 or Q3 2023? The system extracted every character correctly but the data is useless because the spanning relationships are lost.
Research on PubTables-1M confirms this: spanning cells carry header information determining the semantic meaning of all data cells beneath them1. Getting spans wrong does not produce a formatting error. It produces semantically incorrect data.
Cross-Page Tables
A table that continues from page 14 to page 15 has no explicit continuation marker. The second page may repeat headers, or it may not. There is no top border, no "continued from previous page" tag in the PDF structure.
The PubTables-v2 dataset3 provides the first benchmark for this: 9,492 multi-page table instances. Most span 2 pages, but over 200 span 5+ pages, and the longest spans 13 consecutive pages. A ViT-B-16 model achieves 0.991 F1 on continuation detection, meaning the "is this a continuation?" question is largely answered. The harder problem is merging detected continuations into a single coherent table with correct column alignment.
Financial Table Conventions
Financial tables combine every hard problem at once. Indentation encodes hierarchy (Revenue at the left margin, Subscription Revenue indented two levels). Parenthetical negatives mean (1,234) is -1,234. Dot leaders (........) connect labels to values but appear as actual characters in the PDF. Multi-period comparisons show 2-5 years side by side with "in thousands" qualifiers buried in a header.
The ENTRANT dataset4, built from 6.7 million tables across 330,000 SEC EDGAR filings, annotates each cell with approximately 25 attributes including font properties, border presence, and hierarchy levels supporting up to four levels of nesting. This is the scale of annotation needed to train models that handle real financial tables.
PDF Generator Variability
Different PDF generators produce dramatically different internal structures for visually identical tables. Microsoft Word emits each cell as a positioned text block with explicit line segments for borders. LaTeX writes characters individually with computed kerning and draws rules as filled rectangles. Chrome print-to-PDF uses a completely different coordinate system and often splits text across multiple drawing operations. A pipeline tuned for Word-generated PDFs will fail on LaTeX PDFs from the same client, even when both documents look identical on screen. In our fund intake pipeline, we traced a cluster of extraction failures to a single fund administrator that switched from Word to InDesign mid-year. The table layouts did not change. The PDF internals did.
The Algorithms: What Works and What Doesn't
Table extraction has gone through three generations. Each solved something the previous generation couldn't.
Rule-Based Parsing: Tabula, Camelot, pdfplumber
For born-digital PDFs, heuristic tools work directly on the PDF text stream. No ML, no GPU, no training data. Tabula's lattice mode detects line segments and computes cell boundaries from their intersections. Its stream mode infers columns from whitespace gaps. Camelot improves on both with OpenCV morphological operations for line detection and more configurable stream parsing.
pdfplumber takes a different approach: it exposes raw geometric primitives and lets you build custom extraction logic. For a specific bank statement format or a specific regulatory filing, pdfplumber with hand-tuned parameters often produces the best results because the extraction logic can be precisely matched to the layout.
The limitation is generalization. Every new document type requires new rules. When we counted 47 distinct table structures for the Statement of Operations across one client's fund intake, rule-based parsing was not viable.
Detection-Based Models: TATR and CascadeTabNet
TATR (Table Transformer)1 uses a DETR architecture with a ResNet-18 backbone. It runs two separate models: one for table detection, one for structure recognition. On PubTables-1M (scientific papers), structure recognition hits 0.985 GriTS for topology. Cross-domain evaluations tell a different story. The table below shows F1 at IoU 0.6 across five document types:
| Document Type | TATR F1 (IoU 0.6) | Best Rule-Based F1 |
|---|---|---|
| Scientific papers | 0.913 | 0.339 (Camelot) |
| Financial documents | 0.786 | 0.243 (Tabula) |
| Government tenders | 0.750 | 0.828 (Camelot) |
| Manual documents | 0.616 | 0.746 (PyMuPDF) |
| Legal documents | 0.489 | 0.386 (Camelot) |
Two patterns jump out. TATR dominates on scientific documents (its training domain) but rule-based tools actually outperform it on government tenders and manuals, where templates are consistent and heuristics are reliable. Neither approach works well across all domains.
CascadeTabNet5 uses Cascade Mask R-CNN with an HRNet backbone to simultaneously detect tables and recognize cells. It achieved the highest accuracy on the ICDAR 2013 and 2019 structure recognition datasets. The key insight: preserving high-resolution features throughout the network (via HRNet) matters more for document elements than the aggressive downsampling that works for natural images.
Sequence Generation: TableFormer
TableFormer6 (IBM Research) takes a fundamentally different approach. Instead of detecting cells as objects, it generates the table structure as an HTML token sequence. A ResNet-18 encoder feeds a transformer decoder that outputs <tr>, <td>, <td colspan="3"> tags directly.
This avoids the bounding-box-to-cell alignment problem entirely. The model improved TEDS from 91% to 98.5% on simple tables and from 88.7% to 95% on complex tables. TableFormer powers IBM's Docling toolkit, which hits 97.9% cell accuracy in production benchmarks. The subsequent Granite-Docling-258M model matches much larger models at only 258M parameters, processing tables in 400ms on GPU.
The Metric That Matters: TEDS, Not Accuracy
A counterintuitive result that trips up most teams evaluating table extraction models: COCO detection metrics (mAP, IoU) do not correlate with table extraction quality7. A model can improve mAP while producing worse table structures, because tiny bounding box improvements that boost IoU may not affect cell-text alignment, while small errors that barely affect IoU can completely break structural correctness.
TEDS (Tree-Edit-Distance-based Similarity) captures this. It represents each table as an HTML tree and computes the edit distance between predicted and ground-truth structures. If a spanning cell is incorrectly split, all cells beneath it are displaced, and TEDS penalizes the cascading error. When evaluating table extraction, TEDS on complex tables is the number to watch.
Solving the Hard Cases
The algorithms section explains what exists. This section shows how we put them together to handle the cases that no single model gets right.
Resolving Hierarchical Headers
The biggest gap in off-the-shelf table extraction is spanning cell resolution. TATR gives you bounding boxes for rows, columns, and spanning cells. Turning that into structured data with correct parent-child header relationships requires post-processing that no library ships.
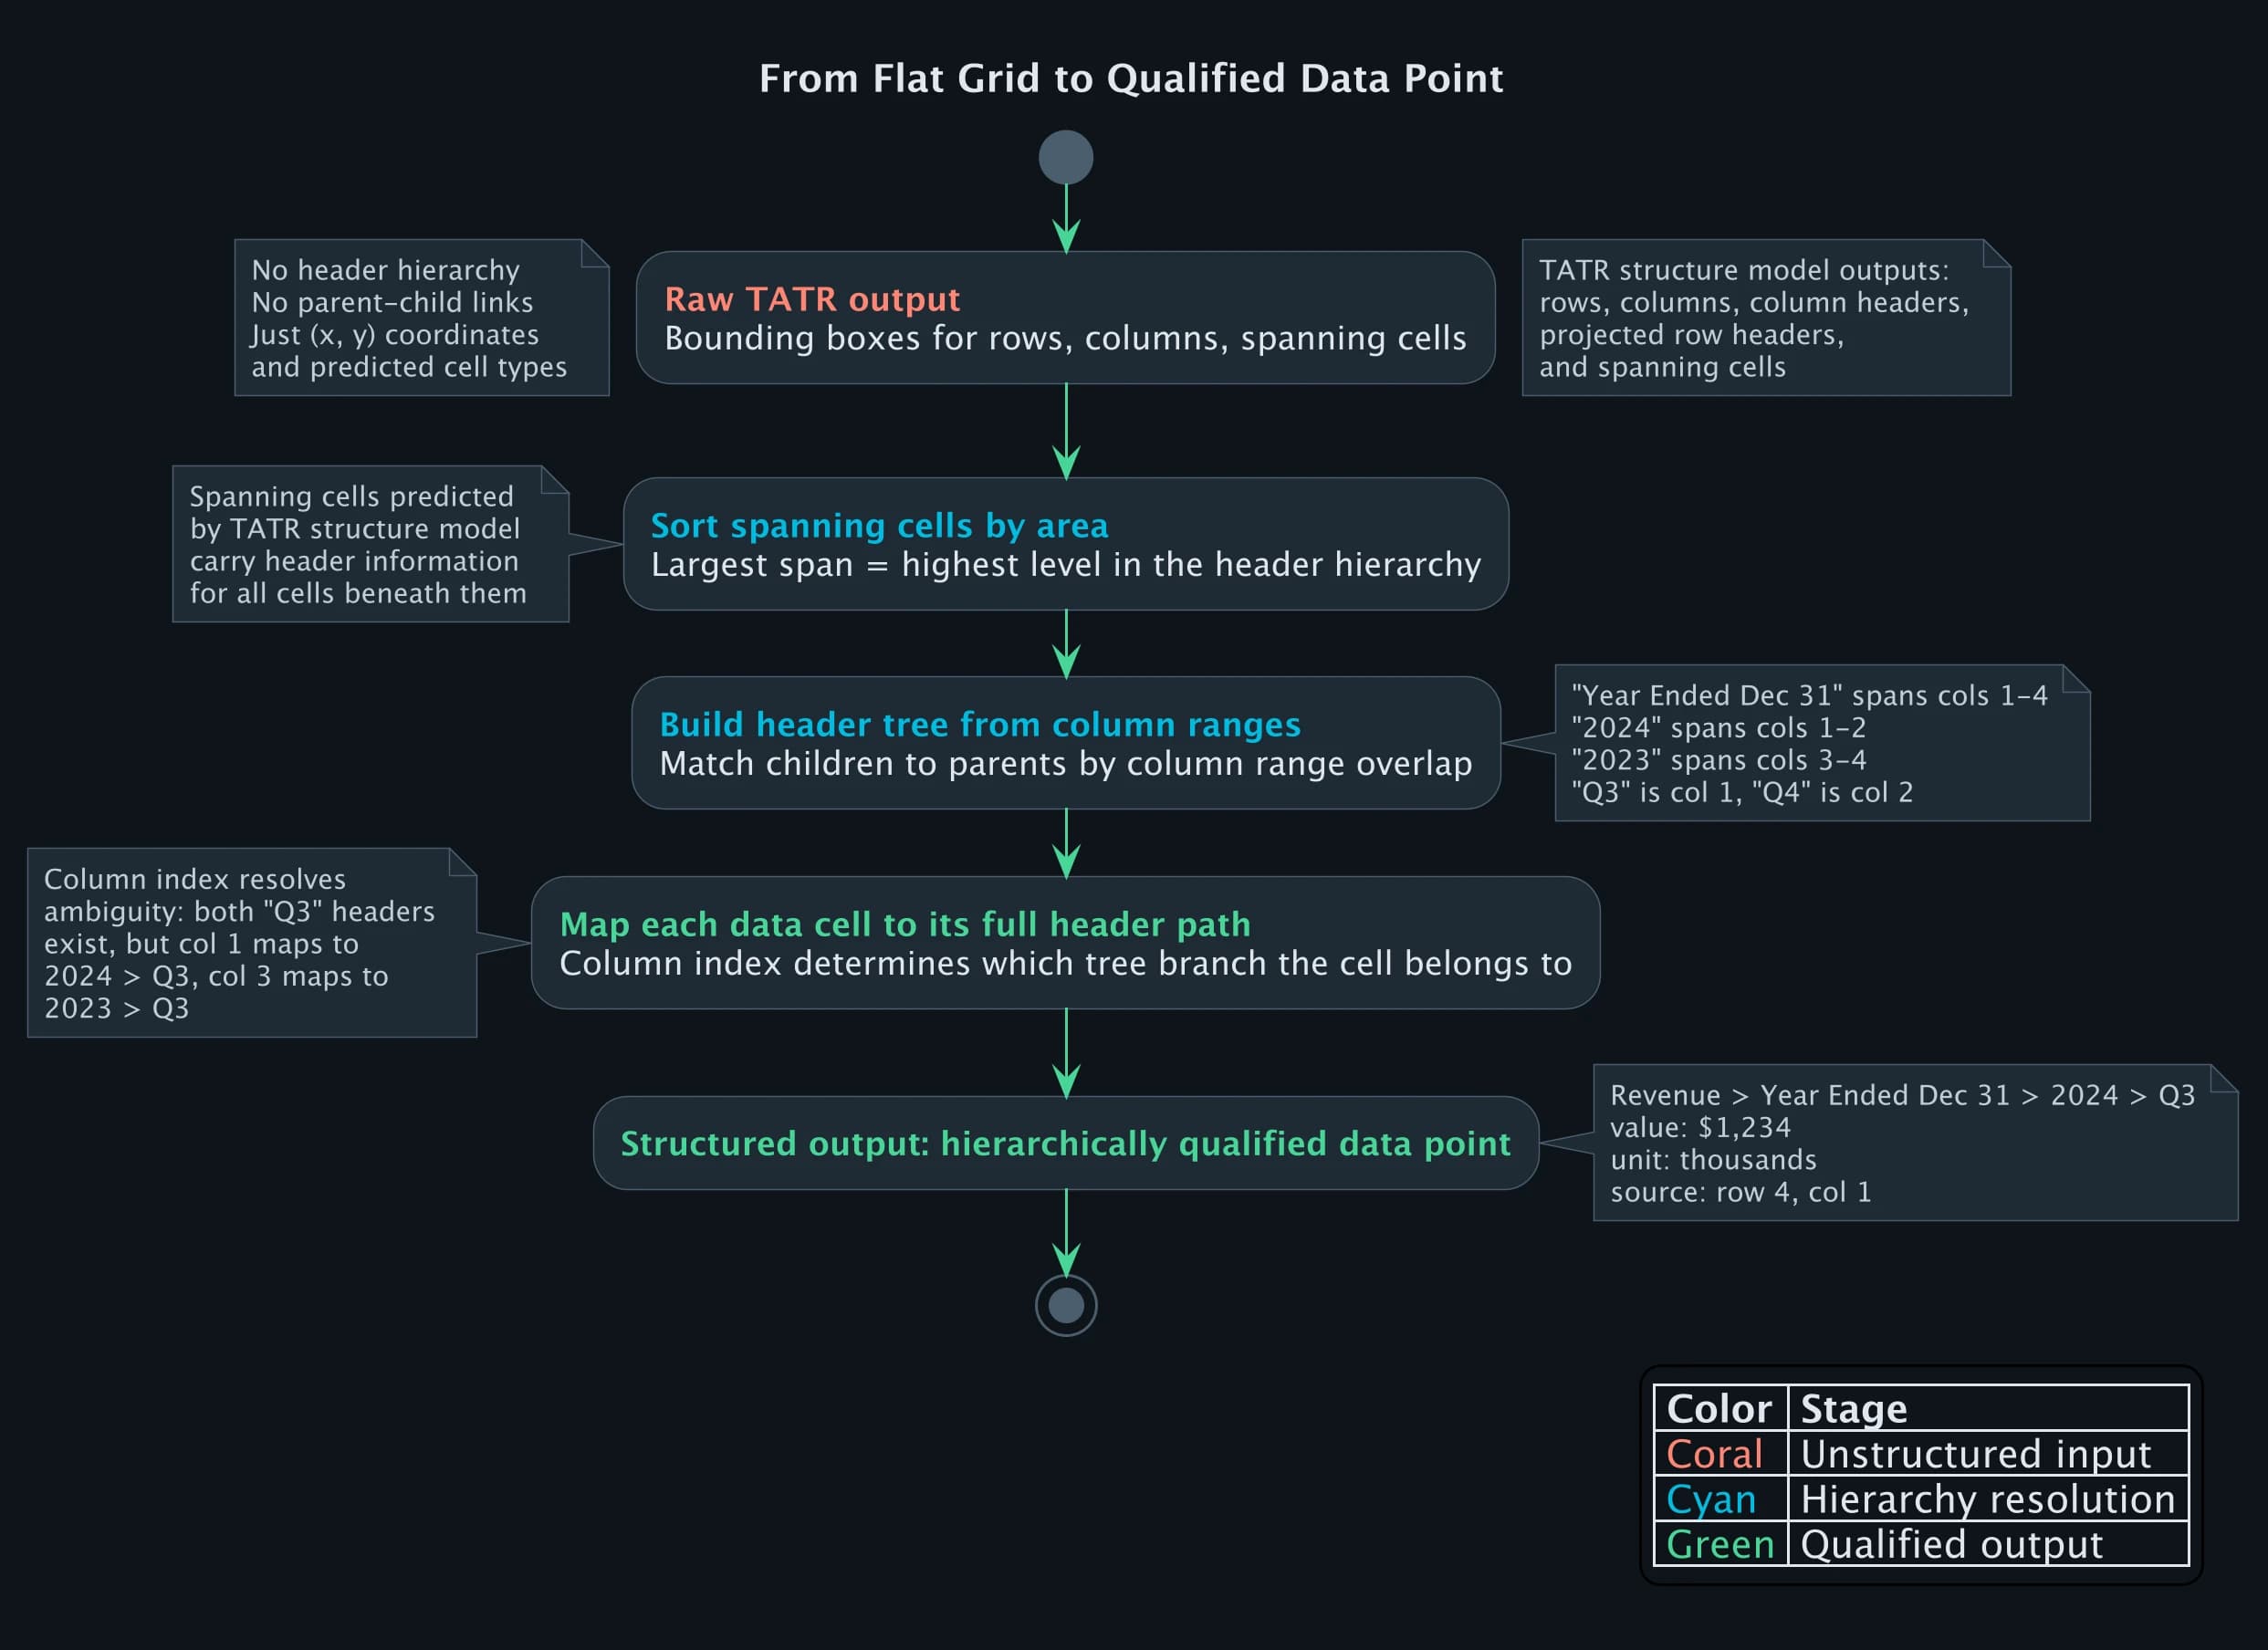
Here is the core of how we resolve multi-level headers. Given TATR's structure predictions, we sort spanning cells by area (largest spans are highest-level headers) and build the header tree:
def resolve_header_hierarchy(structure_pred, cell_texts):
    """
    Turn TATR structure predictions into a header tree.
    spanning_cells: list of {bbox, row_span, col_span}
    """
    headers = sorted(
        structure_pred["spanning_cells"],
        key=lambda c: c["col_span"] * c["row_span"],
        reverse=True  # widest spans first = highest in hierarchy
    )

    header_tree = {}
    for header in headers:
        col_start = header["col_start"]
        col_end = col_start + header["col_span"]
        text = cell_texts.get((header["row"], col_start), "")

        # find children: headers in rows below that fit within this span
        children = [
            h for h in headers
            if h["row"] > header["row"]
            and h["col_start"] >= col_start
            and h["col_start"] + h["col_span"] <= col_end
        ]

        header_tree[text] = {
            "columns": list(range(col_start, col_end)),
            "children": [
                cell_texts.get((c["row"], c["col_start"]), "")
                for c in children
            ],
        }

    return header_tree
On the fund annual report example from above, this produces:
{
  "Year Ended December 31,": {
    "columns": [1, 2, 3, 4],
    "children": ["2024", "2023"]
  },
  "2024": {
    "columns": [1, 2],
    "children": ["Q3", "Q4"]
  },
  "2023": {
    "columns": [3, 4],
    "children": ["Q3", "Q4"]
  }
}
Now the value 1,234 at column 1 can be resolved to "Revenue > Year Ended December 31, > 2024 > Q3". The flat grid becomes a hierarchically qualified data point. Without this step, every extraction from a multi-level financial table is ambiguous.
The Routing Decision That Matters
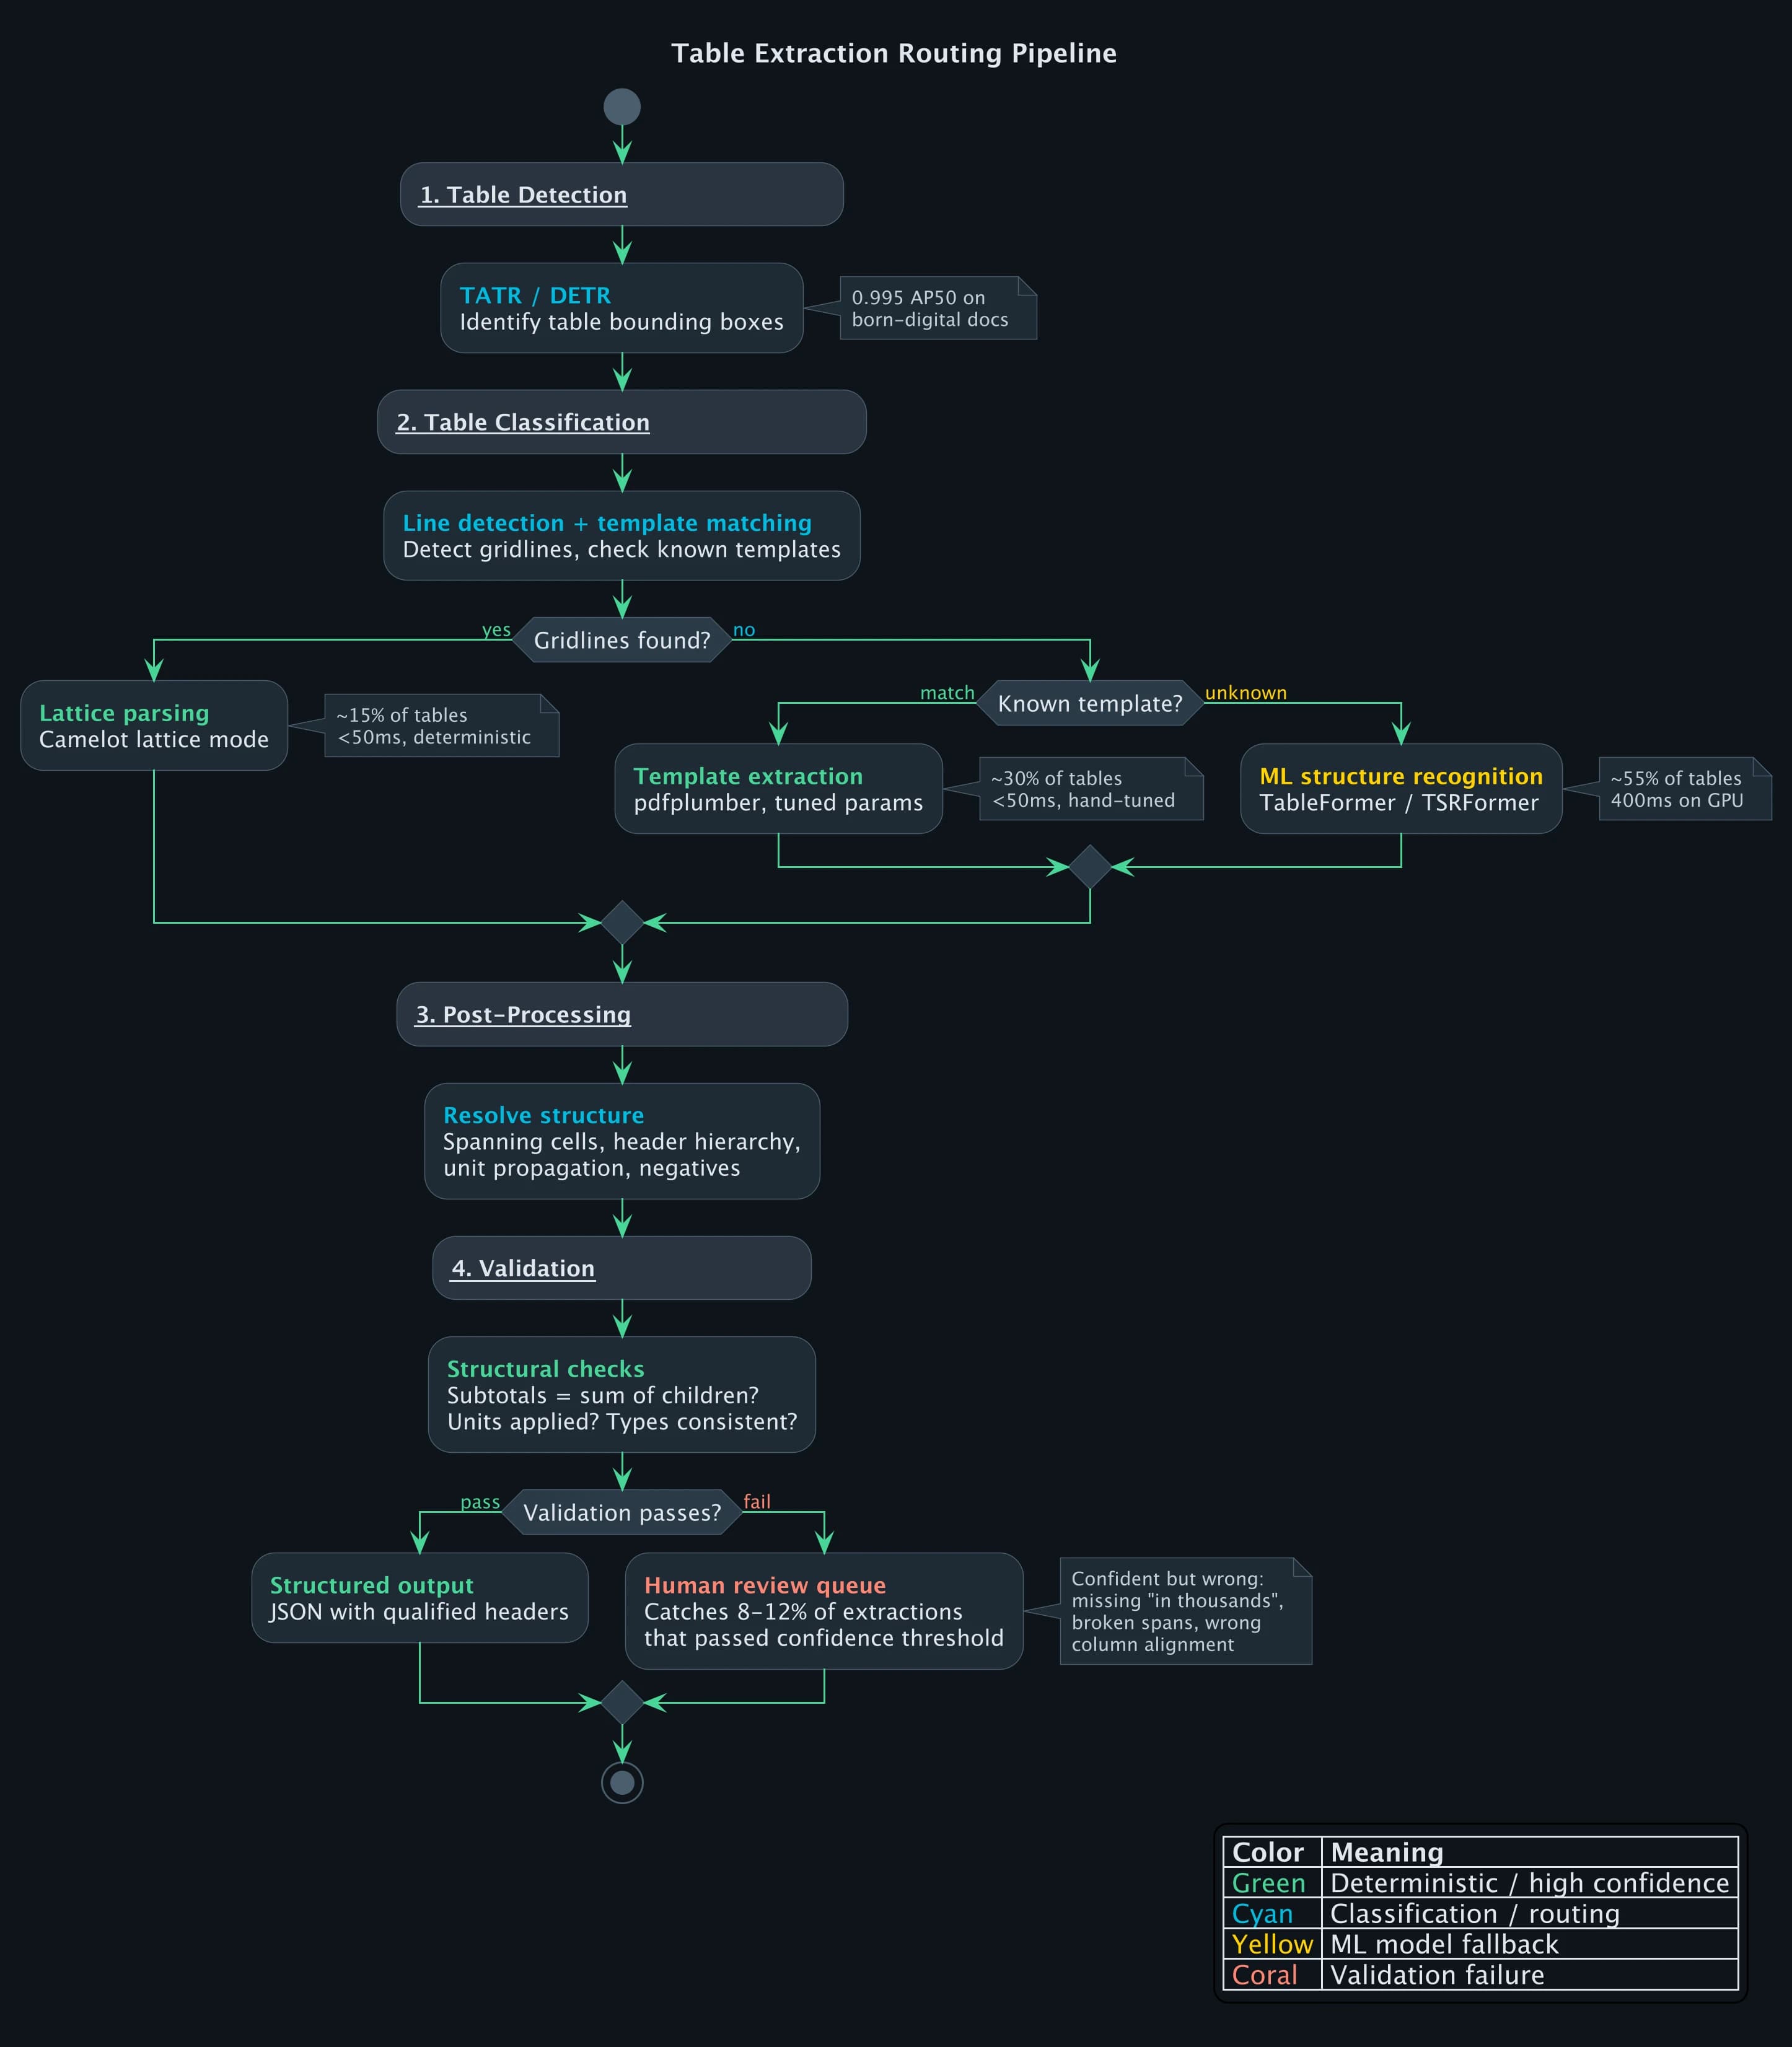
When a table enters the pipeline, the extraction path depends on what the classifier finds. Route a borderless financial table to Camelot's lattice mode and you get an empty result (no lines to detect). Route a fully bordered government form to TableFormer and you waste GPU time while introducing model error on a problem that Camelot solves deterministically at 99%+ accuracy.
The classifier checks for gridlines first. If it finds horizontal and vertical rules forming a complete grid, the table goes to Camelot's lattice parser: deterministic, under 50ms, no model involved. If the layout matches a known template from previous filings by the same fund family, pdfplumber handles it with hand-tuned parameters, also under 50ms. Everything else goes to ML-based structure recognition at 400ms on GPU.
On our fund annual report pipeline, those three paths split roughly 15/30/55. The first two paths are fast and reliable. The ML path is where extraction errors concentrate, which is why the validation step after it matters so much.
Validation: Catching Silent Failures
The most dangerous table extraction errors are the ones that look correct. A model extracts a financial table, every cell has a value, the output is well-formed JSON. But "Total Revenue" is $12,340 when the actual value is $1,234,000 because the model missed "in thousands" in a header two rows above.
Three validation rules catch the majority of these.
First, subtotal consistency: if a row is labeled "Total Revenue" and has child line items, the total must equal the sum of its children. When the model misses a unit qualifier, this check fires. Total Revenue of $12,340 does not equal $1,234 + $456 + ... because the raw values are correct but unscaled. The table gets flagged for human review instead of silently propagating a three-orders-of-magnitude error into a client's data warehouse.
Second, parenthetical negatives. In financial statements, (1,234) means -1,234. If the extracted value is positive but the raw text is wrapped in parentheses, the sign was not applied. This sounds trivial, but a missed negative on an expense line flips a loss into a profit.
The third check is unit propagation. When a header says "in thousands" or "in millions," every data cell beneath it must have that multiplier applied. If any cell's raw value passes through unscaled, the validation flags it.
On our fund intake pipeline, these three checks catch 8-12% of extractions that would have passed a naive confidence threshold. These are not low-confidence extractions. They are extractions where the model was confident and wrong.
What Vision-Language Models Changed (and Didn't)
GPT, Claude, and Gemini can look at a table image and output structured data in one API call. The zero-shot capability is compelling: no specialized model, no training data, no pipeline engineering.
But for production table extraction, VLMs are not viable as the primary extractor. On a fund's Statement of Changes in Net Assets, we watched a VLM return $4,231 for a cell that contained $4,321. The number is plausible, fits the pattern, and would pass a format check. It's just wrong. Run the same table image through the same model three times and you get three different column orderings. And at $0.01-0.03 per page for vision tokens, a VLM costs 50-100x more than a specialized model on GPU.
Where VLMs fit in the pipeline: as a fallback for the long tail of table formats that no specialized model handles, with mandatory validation against the source PDF. We use them on roughly 5% of tables, the ones where the ML model's confidence is below threshold and no template match exists. Even then, every VLM-extracted value gets cross-checked against the PDF text layer before it enters the output.
Frequently Asked Questions
Why does PDF table extraction fail on financial documents?
Financial tables combine every hard problem: borderless layouts, multi-level spanning headers, indentation-based hierarchy, parenthetical negatives, dot leaders, and multi-period comparisons. Models trained on scientific papers (the largest available training set) degrade from 0.913 F1 to 0.786 F1 on financial documents because the visual conventions are fundamentally different.
What is the TEDS metric and why does it matter for table extraction?
TEDS (Tree-Edit-Distance-based Similarity) measures how closely a predicted table structure matches the ground truth by comparing their HTML tree representations. Unlike IoU-based detection metrics, TEDS captures cascading errors: if one spanning cell is wrong, every cell beneath it is displaced. Current state-of-the-art reaches 98.5% TEDS on simple tables and 95% on complex tables with spanning cells.
Can I extract tables from scanned PDFs?
Yes, but accuracy drops significantly. On a Chinese financial dataset benchmark, wired table extraction achieves 98.4% F1 on digital PDFs but drops to 84.2% on scanned PDFs, a 14.2 percentage-point degradation from OCR errors alone. Scanned documents require OCR as a preprocessing step, adding an error layer before table extraction begins.
Should I use rule-based tools or ML models for table extraction?
It depends on your document mix. For known, consistent layouts (specific bank statements, standardized regulatory forms), rule-based tools like pdfplumber produce the best results because you can tune the logic precisely. For variable layouts across many document types, ML models generalize better. Production systems use both, routing each table to the best extractor based on what the classifier finds.
References
Footnotes
-
Smock et al., "PubTables-1M: Towards comprehensive table extraction from unstructured documents" (CVPR 2022) ↩ ↩2 ↩3
-
Zhong et al., "Image-based table recognition: data, model, and evaluation" (ECCV 2020) ↩
-
Smock et al., "PubTables-v2: Multi-page table extraction" (2024) ↩
-
ENTRANT: Financial table dataset, Nature Scientific Data (2024) ↩
-
Prasad et al., "CascadeTabNet: End to end table detection and structure recognition" (CVPR Workshop 2020) ↩
-
Nassar et al., "TableFormer: Table Structure Understanding with Transformers" (CVPR 2022) ↩
-
Shi et al., "Rethinking Detection Based Table Structure Recognition" (2023) ↩
Document AI
Part 2 of 4
- 1.Document Processing in Production: Why Every Platform Breaks at 60%
- 2.PDF Table Extraction: Why Structure Recognition Breaks
- 3.LLM vs OCR Pipeline: Why the Answer Is Both
- 4.SEC EDGAR and XBRL: Financial Document AI at Scale